Introduction
netshape is a command-line that is designed to help scaffold browser-based
network visualizations, so that they can be shared with others in an interactive manner while still remaining lightweight. Often it is useful to zoom and pan around a network in order to get a sense of
particular details that any static image could not capture. netshape is
the solution to that problem.
Default Usage
By default, netshape offers two subcommands, though it can be easily extended
to include more.
netshape buildaccepts as arguments the name of a csv-formatted edgelist file (JSON network option coming soon), or a csv-formatted edgelist from
stdin, as well as some optional parameters. The eigenvector centrality, degree, and a modularity maximizing community assignment is then computed for all nodes. A json representation of this network is then used alongside the d3.js library to build a visualization of the network in the browser, by default in a subfolder named ‘dist’ which can be coloured according to the statistics that were computed earlier.Arguments
-
network¶ The csv formatted edgelist representing the network to be visualized. Also accepts from
stdin
-
-h,--help¶ Displays a help message.
-
-sSEP,--sepsSEP¶ the string delimiter between values in the edgelist (default: ”,”)
-
-dDIRECTED,--directedDIRECTED¶ Boolean indicator - true if the graph is directed (default: True)
-
-oOUT,--outOUT¶ The name of the file to build the web visualization in (default: “dist”)
-
-nNAME,--nameNAME¶ The name of the visualization in that appears in the browser UI (default: “Network”)
-
netshape servea utility function that serves the web visualization on a localhost server (port 8000 by default)
Arguments
-
-pPORT,--portPORT¶ The port to serve on.
-
Web Interface
Below is a sample view of the default web interface for the visualization. The particular network is a C. Elegans neural connectome.
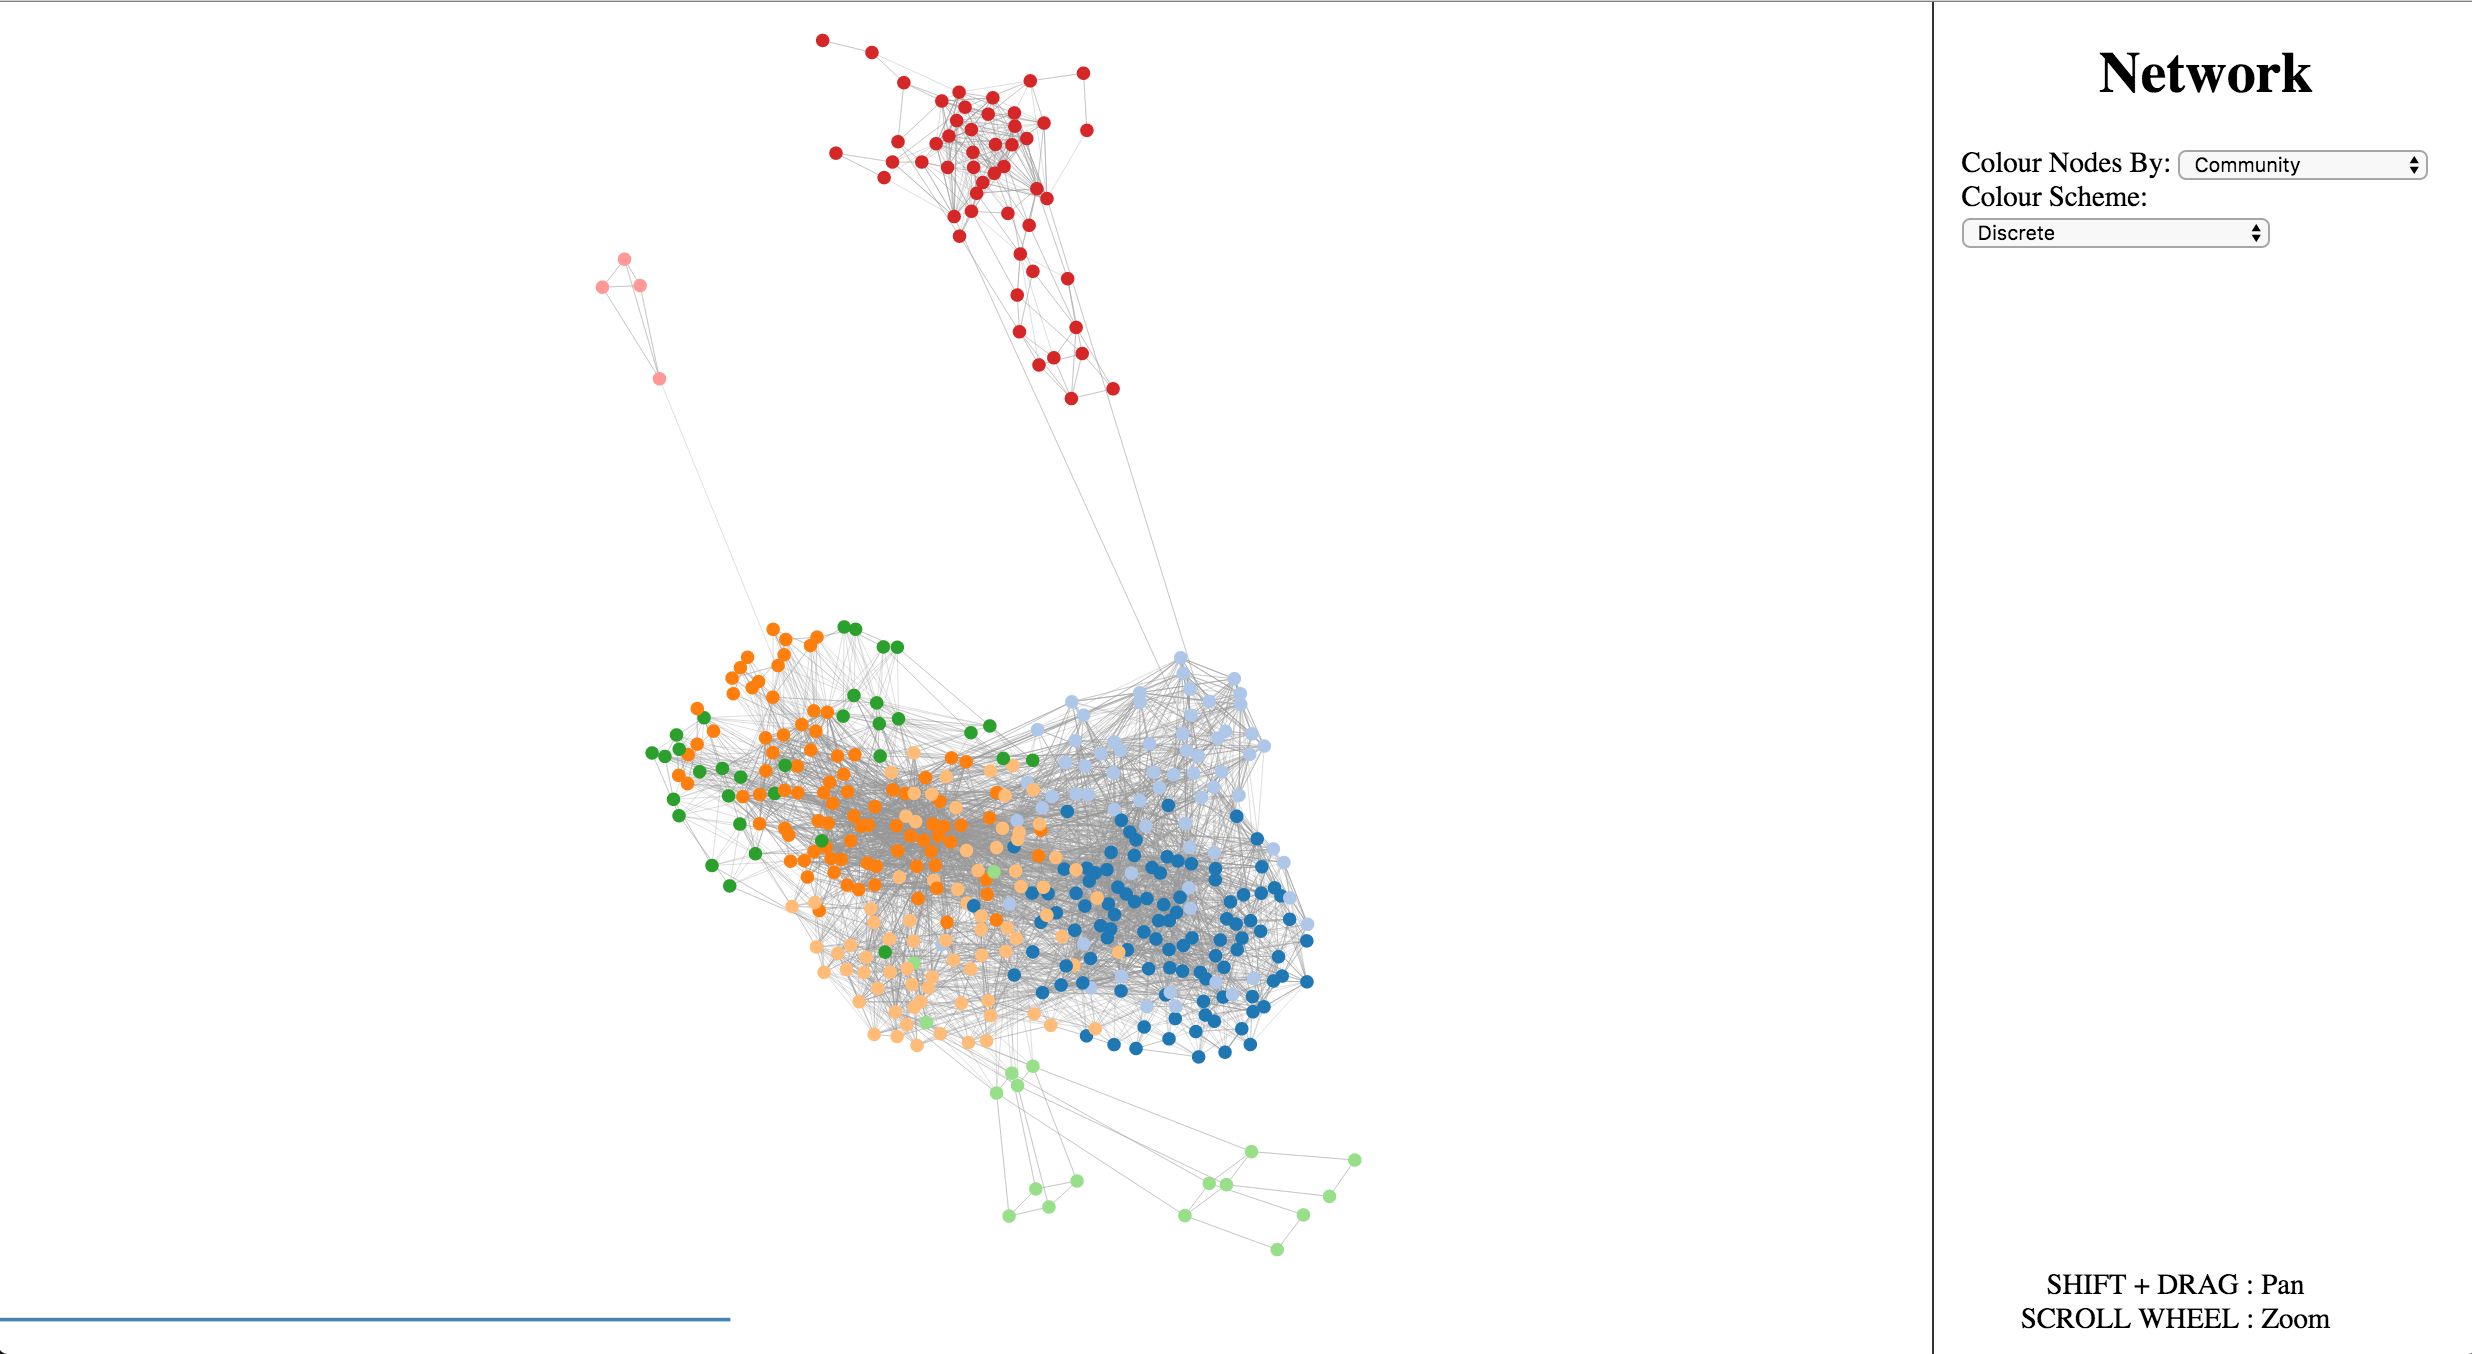
There are options on the right side to colour the network according to the various network statistics that were computed before it was built, as well as choose between discrete and continuous colour schemes. It is also possible to zoom and pan the view of the network. When the mouse hovers over a node, that node’s ID will appear above the node. Nodes are arranged according to a force-directed layout, but can be dragged interactively by clicking and dragging with the mouse.